Examine SRUM-DUMP output
Open a copy of the generated workbook in LibreOffice Calc. Keep the hashed parser output unchanged and perform sorting, filtering, notes, and annotations in a labelled analysis copy.
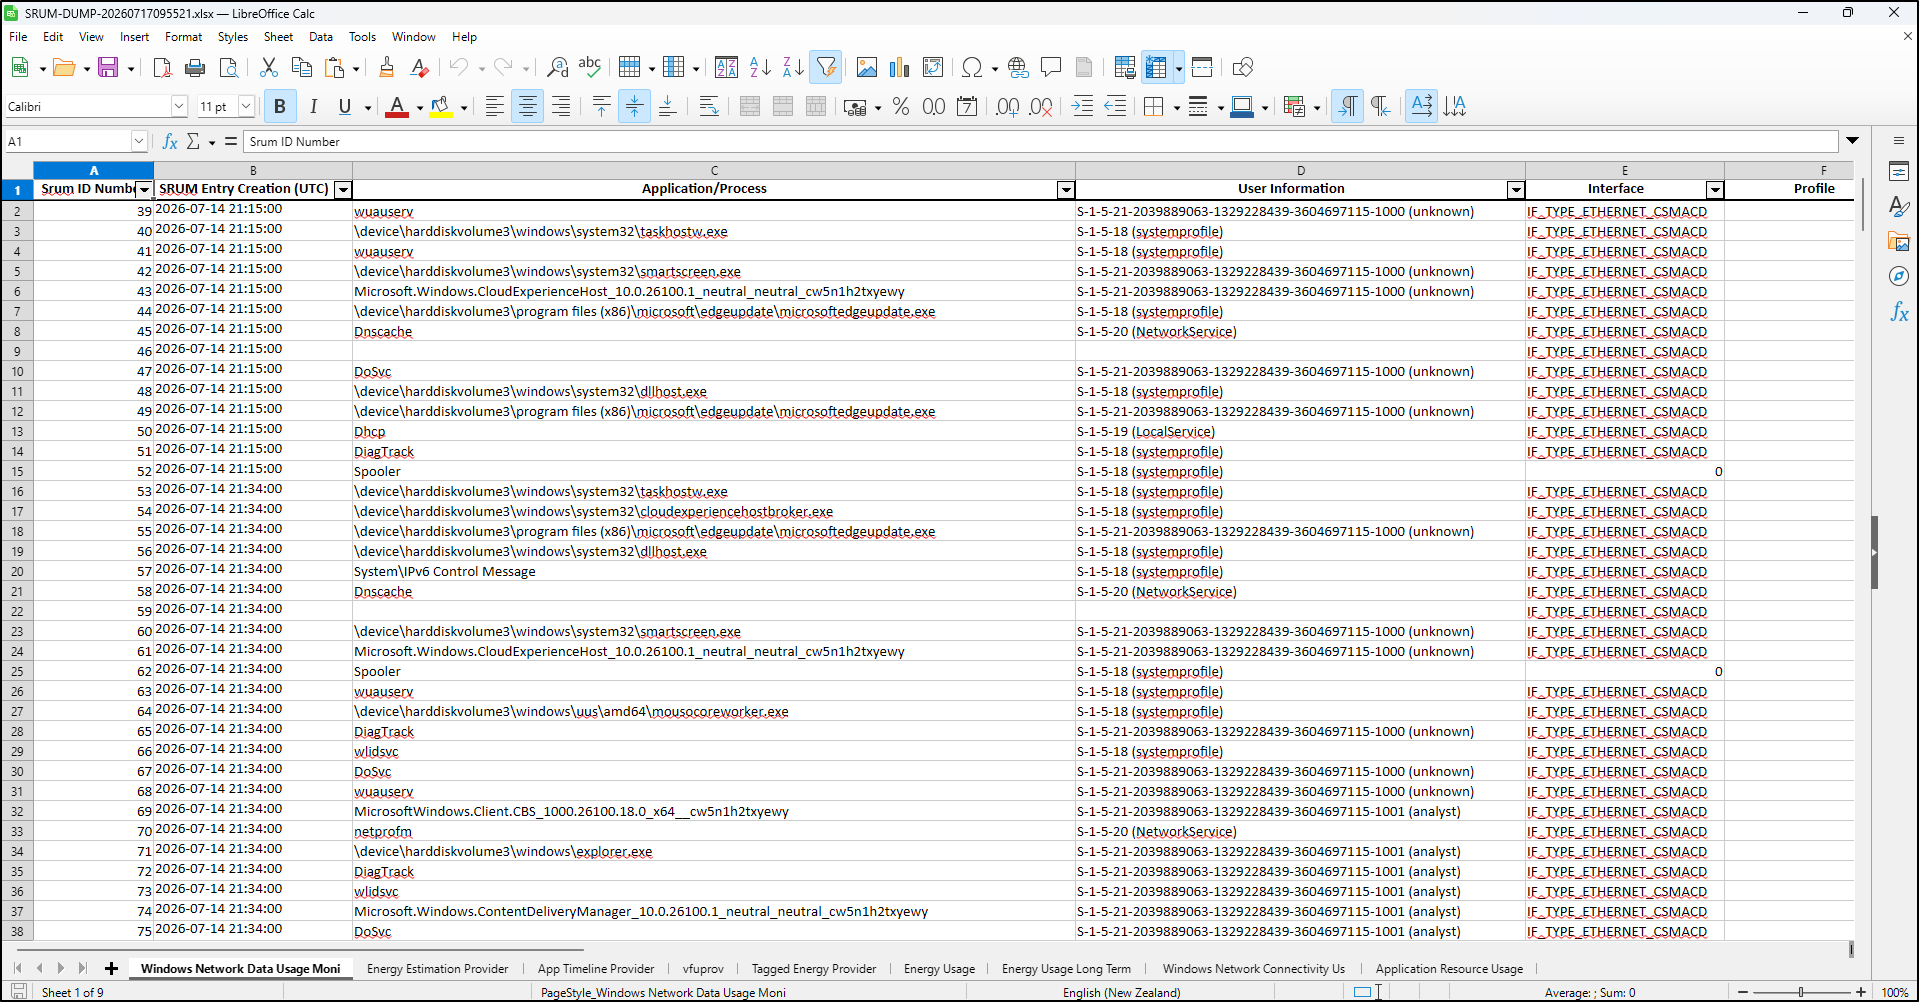
Read the workbook before filtering
The screenshot shows nine worksheets. The exact tabs and columns depend on the Windows build, database contents, SRUM-DUMP configuration, and parser version. Start by recording the workbook filename, hash, sheet names, row counts, active filters, and visible time fields.
1
Identify the table
Read the full worksheet name from the tab and configuration mapping. Do not generalise a field from one SRUM table to another.
2
Preserve field labels
Record headers exactly as displayed, including units and (UTC). A familiar
looking column can have table-specific meaning.
3
Establish the population
Capture the initial data-row count before filtering. Note blank, unresolved, duplicate, or unexpected values without deleting them.
4
Filter from the question
Use a bounded UTC window, application clue, user identifier, interface, or profile. Keep a filter log so the view can be reconstructed.
A practical LibreOffice workflow
1. Protect the original output
- Verify the workbook hash against the parser output manifest.
- Open it without enabling untrusted macros or external content.
- Save a labelled analysis copy, such as
SRUM-DUMP-SUSA-114-analysis.xlsx. - Record the analysis-copy hash before and after material changes.
2. Establish the time and identity context
Confirm the source host time zone and the exact workbook field labels. The shown worksheet uses SRUM Entry Creation (UTC). Keep this as UTC while correlating, or document any conversion in a separate column without replacing the source value.
Application paths can appear as device paths, conventional paths, service names, or package identities. User information can include a SID with a resolved name, a well-known account, or an unresolved identifier. Preserve both raw and resolved forms when available.
3. Apply a reproducible filter
- Select one cell in the populated table.
- Choose Data, then AutoFilter if filters are not already enabled.
- Filter SRUM Entry Creation (UTC) to the case window.
- Filter Application/Process with the smallest case-relevant clue.
- Add User Information, Interface, or Profile only when it helps answer the stated question.
- Record every criterion and the remaining row count in your notes.
Filter in stages
Count and preserve each stage: full sheet, time window, application clue, then identity or interface. A single complex filter is harder for another analyst to audit and easier to misconfigure.
4. Pivot between relevant worksheets
Use the time, application, and user fields as correlation keys, but expect different schemas and aggregation. A useful sequence is:
- In a network usage sheet, identify the application, user, time, interface or profile, and displayed sent and received values.
- In the application timeline or resource usage sheet, look for corresponding application records in the same bounded period.
- Test the observation against firewall, proxy, DNS, browser, event-log, Prefetch, Amcache, file-system, or other authorised evidence.
Do not sum unlike tables without understanding their units and aggregation. Avoid treating repeated application rows as separate launches unless the table definition and corroborating evidence support that interpretation.
5. Export a focused result
Preserve the complete parser workbook. For a review package, export only the relevant rows to a new CSV or workbook and include:
- source workbook name and SHA-256;
- worksheet name and original row identifiers;
- exact filters and filter order;
- displayed field names, values, units, and time zone;
- SRUM-DUMP version, engine, command or GUI settings;
- analyst interpretation, confidence, limitations, and corroboration; and
- focused-export SHA-256.
Observation
The Windows Network Data Usage Monitor sheet contains records for the
displayed application, user identifier, UTC buckets, interface, and byte values.
Interpretation
The records are consistent with Windows attributing network usage to that application and identifier during the examined period.
Limitation
SRUM alone does not identify the remote destination, prove transfer success, attribute intent to a person, or establish an exact application start time.
Next step
Correlate the bounded period with network telemetry and endpoint artefacts, then test any file-transfer hypothesis against file-system and application evidence.
Analysis traps
| Trap | Better practice |
|---|---|
| Treating every row as a process execution | Describe the table and displayed resource record; use execution artefacts for execution claims. |
| Converting UTC without recording the method | Preserve source UTC, add a documented local-time derivative, and retain the offset. |
| Assuming a resolved profile proves location | Treat the profile as configuration context and corroborate actual connectivity. |
| Naming a remote destination from byte counts | Use firewall, proxy, DNS, flow, or packet evidence for destination claims. |
| Saving filters over the only workbook | Preserve the hashed parser output and work in a labelled analysis copy. |
| Reporting only a screenshot | Export the relevant rows with source, filter, tool, and hash context. |